Market Outlook
January 31, 2018
Market Cues
Domestic Indices
Chg (%)
(Pts)
(Close)
Indian markets are likely to open negative tracking global indices and SGX Nifty.
BSE Sensex
(0.7)
(250)
36,034
US stocks saw further downside during the last trading session. The weakness on
Nifty
(0.7)
(81)
11,050
Wall Street was partly due to profit taking, with traders cashing in on the recent
Mid Cap
(0.7)
(119)
17,591
strength of the markets.The Dow Jones dipped to 1.4% to close at 26,077 and the
Small Cap
(1.3)
(256)
18,874
Nasdaq Composite edged down to 0.9%, to 7,402.
Bankex
(0.8)
(264)
30,861
U.K. shares fell for the first time in three days after U.S. bond yields rose on
expectations of a rise in real interest rates and a leaked internal report showed
Global Indices
Chg (%)
(Pts)
(Close)
Britain will be left worse off under all Brexit scenarios. The FTSE 100 was down by
Dow Jones
(1.4)
(363)
26,077
1.1% to close at 7,588.
Nasdaq
(0.9)
(64)
7,402
On domestic front, Indian shares ended notably lower as investors waited for cues
FTSE
(1.1)
(84)
7,588
from Thursday's budget that will be the last full year budget of the government
Nikkei
(0.1)
(31)
23,261
before next year's Lok Sabha election. The Sensex ended on a downside front of
Hang Seng
(0.8)
(264)
32,343
0.7% at 36,034 while the Nifty ended at 11,050 with a downside of 0.7%.
Shanghai Com
(0.5)
(19)
3,469
News Analysis
Advances / Declines
BSE
NSE
Rs 2,600cr special package likely for leather and footwear industry
Advances
754
418
Detailed analysis on Pg2
Declines
2,113
1,387
Investor’s Ready Reckoner
Unchanged
147
49
Key Domestic & Global Indicators
Stock Watch: Latest investment recommendations on 150+ stocks
Volumes (` Cr)
Refer Pg5 onwards
BSE
5,285
NSE
34,631
Top Picks
CMP
Target
Upside
Company
Sector
Rating
(`)
(`)
(%)
Net Inflows (` Cr)
Net
Mtd
Ytd
Blue Star
Capital Goods
Buy
742
867
16.8
FII
644
13,216
13,216
Dewan Housing Finance
Financials
Buy
588
712
21.0
Asian Granito
Other
Buy
550
651
18.3
*MFs
(8)
5,003
5,003
Navkar Corporation
Other
Buy
183
265
44.5
KEI Industries
Capital Goods Accumulate
386
436
13.0
Top Gainers
Price (`)
Chg (%)
More Top Picks on Pg4
Rcom
30
10.5
Key Upcoming Events
Kpit
219
4.8
Previous
Consensus
Date
Region
Event Description
Hindpetro
392
4.6
Reading
Expectations
Balkrisind
1,157
4.3
Jan31
Euro Zone Euro-Zone GDP s.a. (QoQ)
0.70
0.60
Jan31
China
PMI Manufacturing
51.60
51.60
Ioc
416
4.2
Feb01
UK
PMI Manufacturing
56.30
56.50
Feb01
US
Initial Jobless claims
233.00
235.00
Top Losers
Price (`)
Chg (%)
Feb01
Germany
PMI Manufacturing
61.20
61.20
More Events on Pg7
Wockpharma
826
(9.2)
Justdial
520
(7.5)
Emamiltd
1,142
(7.4)
Pcjeweller
523
(7.2)
Intellect
162
(7.2)
As on January 30 2018
Market Outlook
January 31, 2018
News Analysis
Rs 2,600cr special package likely for leather and footwear industry
An Rs 2,600cr special package for the leather and footwear industry is expected to
be announced in Chennai on Wednesday, by Union Minister for Commerce and
Industry Suresh Prabhu.
This package would generate around 300,000 jobs. The Council for Leather
Exports is working on various programmes to utilize the Rs 26 billion grant given
by the Central Government within the stipulated period of three years. The special
incentive package will be for human resource development, setting up of mega
leather, footwear and accessory clusters, integrated development of the leather
sector, leather technology, innovation and environment protection, and promotion
of Indian brands abroad.
Economic and Political News
SBI to launch a credit card exclusively for farmers
Rs 2,600cr special package likely for leather and footwear industry
No material injury from dumping of polyester staple fibre from China
Weak Goa exports, suspension of Odisha mines fail to dent iron ore trade
Corporate News
Thai food conglomerate CP Group to invest in Uttar Pradesh agribusiness
AI and automation is about upscaling business, not job cuts, says TCS COO
Hyundai to drive its first electric car in the Indian market next year
Technology from Suzuki to drive Maruti's first electric car in India
Market Outlook
January 31, 2018
Quarterly Bloomberg Brokers Consensus Estimate
Larsen & Toubro Ltd - Jan 31, 2018
Particulars ( ` cr)
3QFY18E
3QFY17
y-o-y (%)
2QFY18
q-o-q (%)
Sales
28,385
26,286
7.9
26,446
7.3
EBIDTA
2,872
3,868
(25.7)
4,480
(35.9)
%
7.5
14.7
16.9
PAT
1,384
1,090
26.9
2,020
(31.5)
ICICI Bank - Jan 31, 2018
Particulars ( `cr)
3QFY18E
3QFY17
y-o-y (%)
2QFY18
q-o-q (%)
PAT
1,902
2,441
(22.1)
2,058
(7.6)
Vedanta Ltd. - Jan 31, 2018
Particulars ( ` cr)
3QFY18E
3QFY17
y-o-y (%)
2QFY18
q-o-q (%)
Sales
23,611
19,415
21.6
21,590
9.3
EBIDTA
6,627
5,866
12.9
5,560
19.2
%
28.1
30.2
25.7
PAT
2,497
3,146
(20.6)
2,986
(16.4)
NTPC Ltd. - Jan 31, 2018
Particulars ( ` cr)
3QFY18E
3QFY17
y-o-y (%)
2QFY18
q-o-q (%)
Sales
21,029
19,395
(8.5)
19,698
6.8
EBIDTA
5,898
5,226
12.9
5,440
8.5
%
28.1
26.9
27.6
PAT
2,686
2,468
8.8
2,438
10.2
Exide Industries Ltd. - Jan 31, 2018
Particulars ( ` cr)
3QFY18E
3QFY17
y-o-y (%)
2QFY18
q-o-q (%)
Sales
2,076
1,725
20.3
2,371
(12.4)
EBIDTA
260
225
15.6
254
2.4
%
12.5
13.1
10.7
PAT
153
151
1.3
135
13.3
Dabur Ltd. - Jan 31, 2018
Particulars ( ` cr)
3QFY18E
3QFY17
y-o-y (%)
2QFY18
q-o-q (%)
Sales
2,049
1,852
10.6
1,958
4.6
EBIDTA
395
333
18.6
419
(5.8)
%
19.3
18.1
21.5
PAT
340
293
16.1
362
(6.1)
Market Outlook
January 31, 2018
Top Picks
Market Cap
CMP
Target
Upside
Company
Rationale
(` Cr)
(`)
(`)
(%)
Strong growth in domestic business due to its leade`hip
in acute therapeutic segment. Alkem expects to launch
Alkem Laboratories
26,780
2,240
2,441
9.0
more products in USA, which bodes for its international
business.
We expect the company would report strong profitability
Asian Granito
1,656
550
651
18.3
owing to better product mix, higher B2C sales and
amalgamation synergy.
Favorable outlook for the AC industry to augur well for
Cooling products business which is out pacing the
Blue Star
7,118
742
867
16.8
market growth. EMPPAC division's profitability to
improve once operating environment turns around.
With a focus on the low and medium income (LMI)
consumer segment, the company has increased its
Dewan Housing Finance
18,457
588
712
21.0
presence in tier-II & III cities where the growth
opportunity is immense.
Loan growth is likely to pick up after a sluggish FY17.
Lower credit cost will help in strong bottom-line growth.
Karur Vysya Bank
7,875
108
160
47.6
Increasing share of CASA will help in NIM
improvement.
High order book execution in EPC segment, rising B2C
KEI Industries
3,023
386
436
13.0
sales and higher exports to boost the revenues and
profitability
Expected to benefit from the lower capex requirement
Music Broadcast
2,168
380
475
25.0
and 15 year long radio broadcast licensing.
Massive capacity expansion along with rail advantage
Navkar Corporation
2,760
183
265
44.5
at ICD as well CFS augur well for the company
Strong brands and distribution network would boost
Siyaram Silk Mills
3,247
693
851
22.8
growth going ahead. Stock currently trades at an
inexpensive valuation.
Market leadership in Hindi news genre and no.
2
viewership ranking in English news genre, exit from the
TV Today Network
2,714
455
500
9.9
radio business, and anticipated growth in ad spends by
corporate to benefit the stock.
After GST, the company is expected to see higher
volumes along with improving product mix. The Gujarat
Maruti Suzuki
2,89,085
9,570
10,619
11.0
plant will also enable higher operating leverage which
will be margin accretive.
We expect loan book to grow at 24.3% over next two
GIC Housing
2,338
434
655
50.8
year; change in borrowing mix will help in NIM
improvement
We expect CPIL to report net Revenue/PAT CAGR of
~17%/16% over FY2017-20E mainly due to healthy
7,208
324
400
23.3
growth in plywood & lamination business, forayed into
Century Plyboards India
MDF & Particle boards on back of strong brand &
distribution network.
We expect sales/PAT to grow at 13.5%/20% over next
LT Foods
2,795
87
128
46.5
two years on the back of strong distribution network &
addition of new products in portfolio.
We expect sales/PAT to grow at 13%/16% over next two
years on the back of strong healthy demand in writing
Ruchira Papers
416
185
244
31.6
& printing paper and Kraft paper. Further, China had
banned making paper from waste pulp which would
benefit Indian paper companies.
We expect financialisation of savings and increasing
Aditya Birla Capital
38713
170
230
35.3
penetration in Insurance & Mutual fund would ensure
steady growth.
Source: Company, Angel Research
Market Outlook
January 31, 2018
Fundamental Call
Market Cap
CMP
Target
Upside
Company
Rationale
(` Cr)
(`)
(`)
(%)
CCL is likely to maintain the strong growth trajectory
CCL Products
3,863
290
360
24.0
over FY18-20 backed by capacity expansion and new
geographical foray
We forecast Nilkamal to report top-line CAGR of ~9%
to `2,635cr over FY17-20E on the back of healthy
Nilkamal
2,724
1,826
2,178
19.3
demand growth in plastic division. On the bottom-line
front, we estimate ~10% CAGR to `162cr owing to
improvement in volumes.
We expect sales/PAT to grow at 9%/14% over next two
years on the back of healthy demand growth in
Shreyans Industries
257
186
247
33.1
printing. Further, China had banned making paper
from waste pulp which would benefit Indian paper
companies.
The prism has diversified exposure in the different
segment such as Cement, Tile & ready mix concrete.
Prism Cement
6,939
138
160
16.1
Thus we believe, PCL is in the right place to capture
ongoing government spending on affordable housing
and infrastructure projects.
Source: Company, Angel Research
Market Outlook
January 31, 2018
Key Upcoming Events
Result Calendar
Date
Company
Exide Industries, J K Lakshmi Cements, ICICI Bank, IDBI Bank, Dabur India, PVR, Petronet LNG, Alembic Pharma,
January 31, 2018
NTPC, Reliance Infra
February 01, 2018
Ashok Leyland, CEAT, Cummins India, MRF, Power Grid Corpn
Source: Bloomberg, Angel Research
Global economic events release calendar
Bloomberg Data
Date
Time
Country
Event Description
Unit
Period
Last Reported
Estimated
Jan 31, 2018
3:30 PMEuro Zone Euro-Zone GDP s.a. (QoQ)
% Change
4Q A
0.70
0.60
6:30 AMChina
PMI Manufacturing
Value
Jan
51.60
51.60
Feb 01, 2018
3:00 PMUK
PMI Manufacturing
Value
Jan
56.30
56.50
7:00 PMUS
Initial Jobless claims
Thousands
Jan 27
233.00
235.00
2:25 PMGermany PMI Manufacturing
Value
Jan F
61.20
61.20
12:30 AMUS
FOMC rate decision
%
Jan 31
1.50
1.50
Feb 02, 2018
7:00 PMUS
Change in Nonfarm payrolls
Thousands
Jan
148.00
180.00
7:00 PMUS
Unnemployment rate
%
Jan
4.10
4.10
Feb 05, 2018
2:25 PMGermany PMI Services
Value
Jan F
57.00
Feb 07, 2018
2:30 PMIndia
RBI Reverse Repo rate
%
Feb 7
5.75
2:30 PMIndia
RBI Repo rate
%
Feb 7
6.00
2:30 PMIndia
RBI Cash Reserve ratio
%
Feb 7
4.00
Feb 08, 2018
China
Exports YoY%
% Change
Jan
10.90
5:30 PMUK
BOE Announces rates
% Ratio
Feb 8
0.50
0.50
Feb 09, 2018
7:00 AMChina
Consumer Price Index (YoY)
% Change
Jan
1.80
Source: Bloomberg, Angel Research
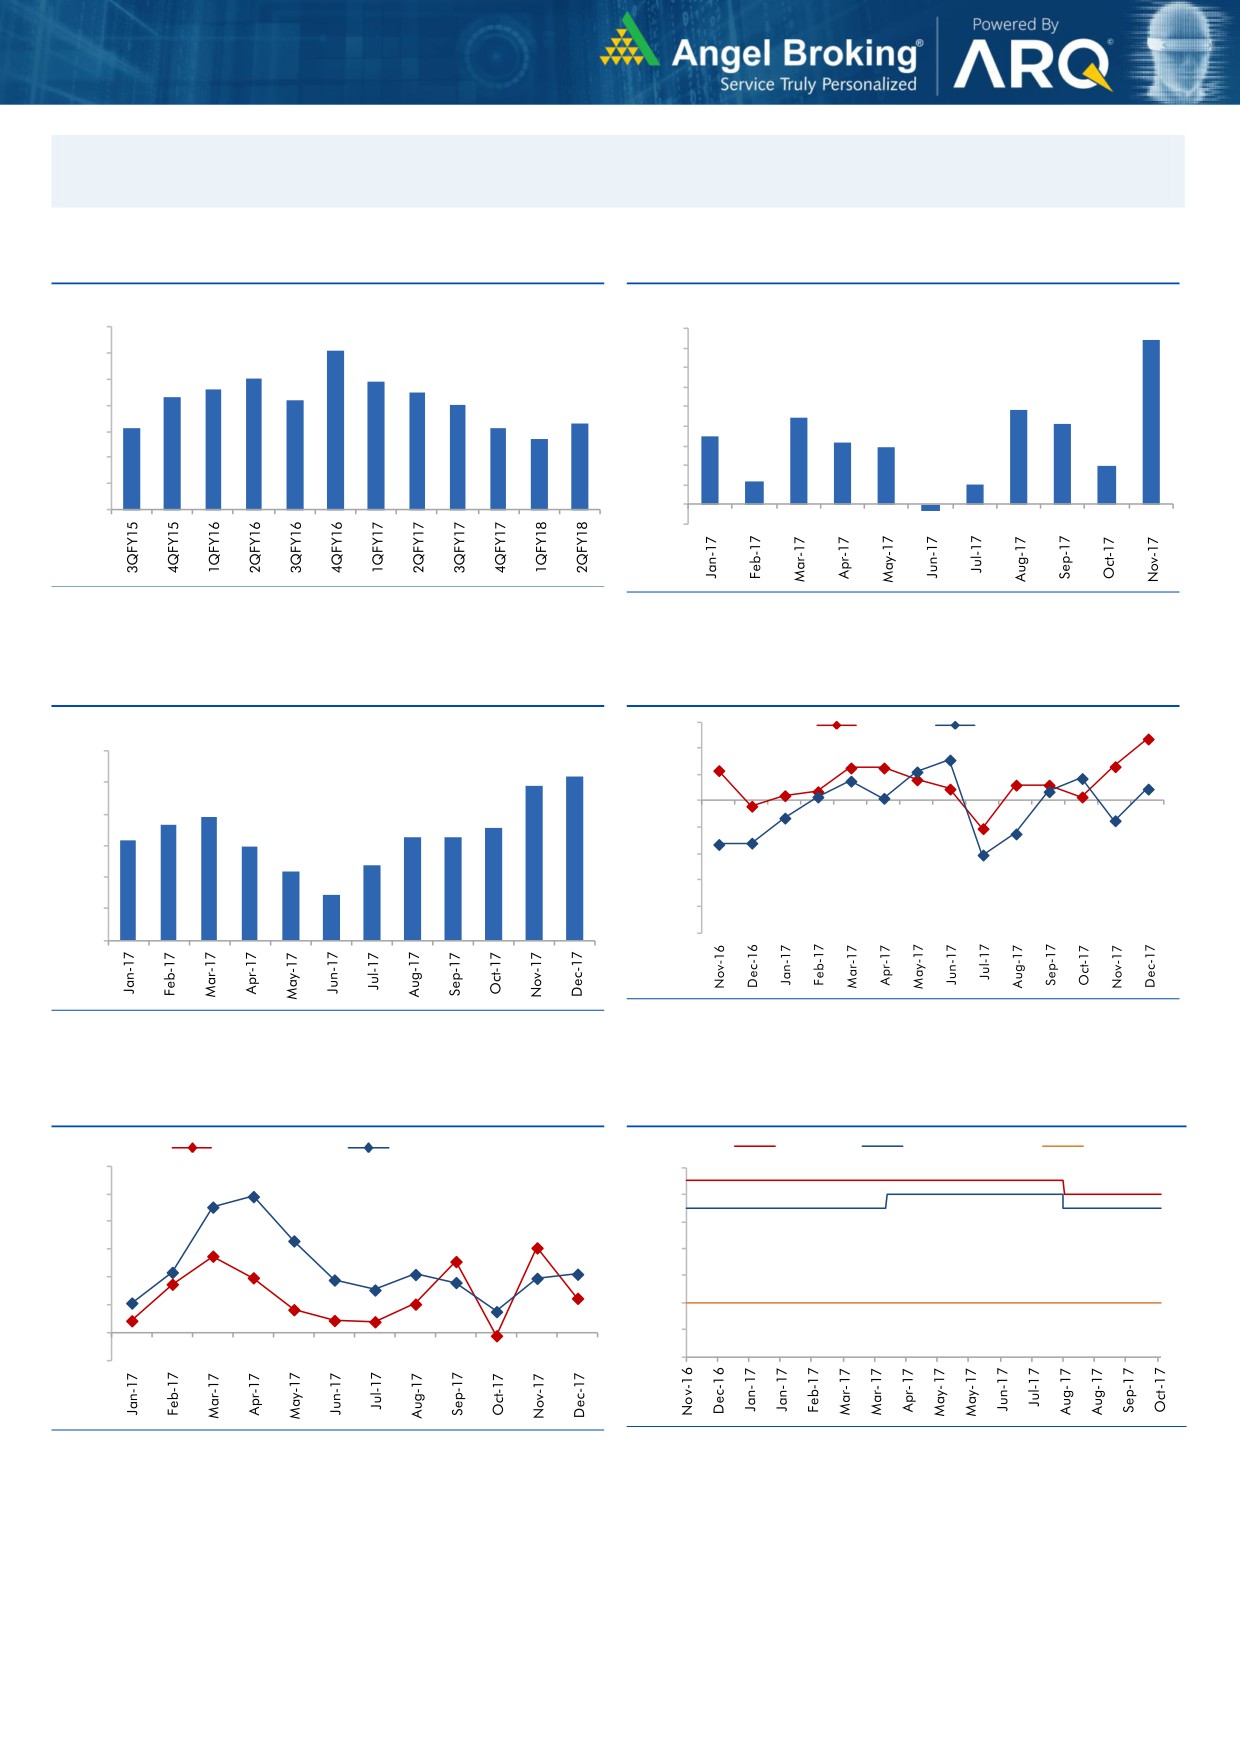
Market Outlook
January 31, 2018
Macro watch
Exhibit 1: Quarterly GDP trends
Exhibit 2: IIP trends
(%)
(%)
10.0
9.0
8.4
9.1
9.0
8.0
8.0
7.9
7.0
7.6
7.5
8.0
7.3
7.2
7.0
6.0
4.8
7.0
6.3
5.0
4.4
4.1
6.1
6.1
5.7
3.5
3.2
6.0
4.0
2.9
3.0
2.0
5.0
2.0
1.2
1.0
4.0
1.0
-
3.0
(1.0)
(0.3)
Source: CSO, Angel Research
Source: MOSPI, Angel Research
Exhibit 3: Monthly CPI inflation trends
Exhibit 4: Manufacturing and services PMI
56.0
Mfg. PMI
Services PMI
(%)
6.0
54.0
5.2
4.9
52.0
5.0
3.9
50.0
3.7
3.6
4.0
3.3
3.3
3.2
3.0
48.0
3.0
2.4
2.2
46.0
2.0
1.5
44.0
1.0
42.0
40.0
-
Source: Market, Angel Research; Note: Level above 50 indicates expansion
Source: MOSPI, Angel Research
Exhibit 5: Exports and imports growth trends
Exhibit 6: Key policy rates
(%)
Exports yoy growth
Imports yoy growth
(%)
Repo rate
Reverse Repo rate
CRR
60.0
6.50
50.0
6.00
40.0
5.50
30.0
5.00
20.0
4.50
10.0
4.00
0.0
3.50
(10.0)
3.00
Source: Bloomberg, Angel Research
Source: RBI, Angel Research
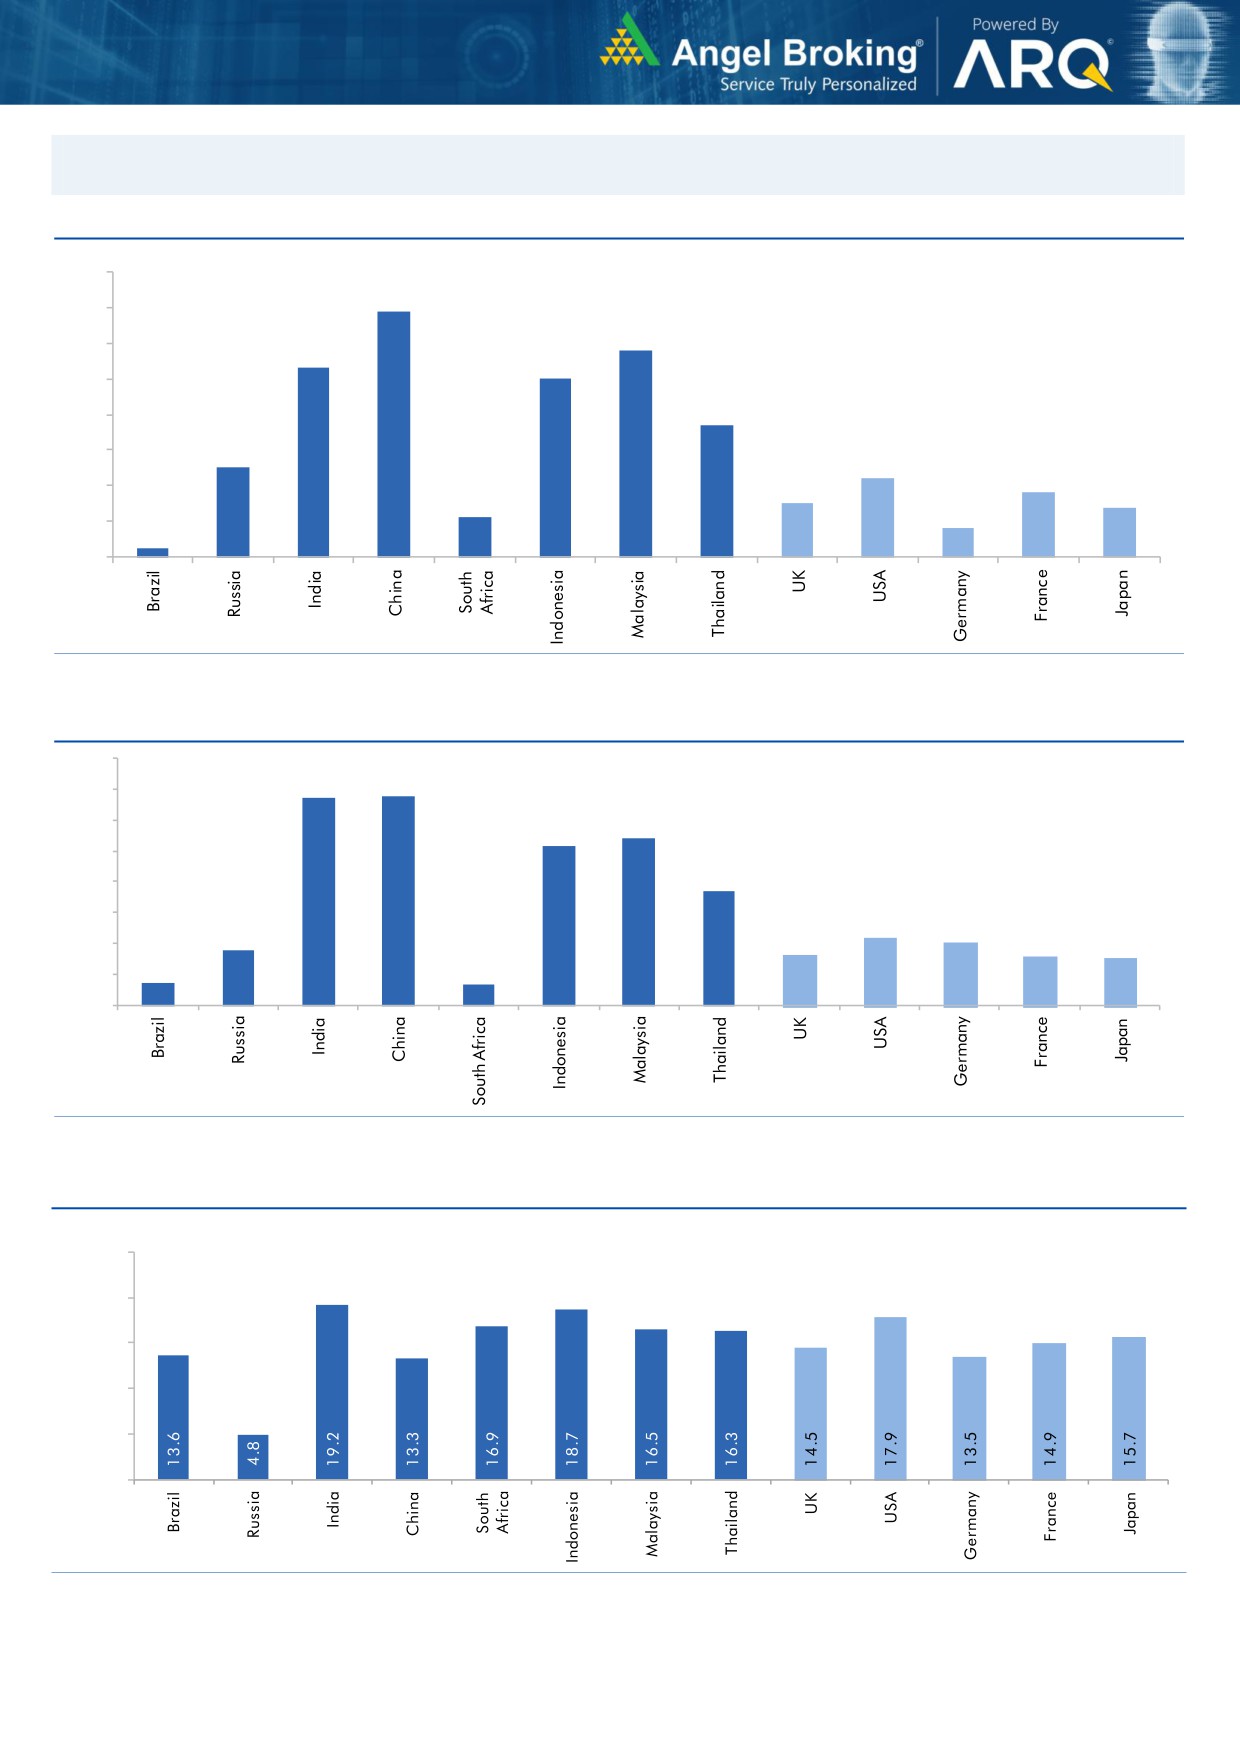
Market Outlook
January 31, 2018
Global watch
Exhibit 1: Latest quarterly GDP Growth (%, yoy) across select developing and developed countries
(%)
8.0
6.9
7.0
5.8
6.0
5.3
5.0
5.0
1.1
3.7
4.0
2.5
3.0
2.2
1.8
2.0
1.5
1.4
0.8
1.0
0.3
-
Source: Bloomberg, Angel Research
Exhibit 2: 2017 GDP Growth projection by IMF (%, yoy) across select developing and developed countries
(%)
6.7
6.8
7.0
6.0
5.4
5.2
5.0
3.7
4.0
3.0
1.8
2.2
2.0
1.7
1.6
2.0
0.7
1.5
0.7
1.0
-
Source: IMF, Angel Research
Exhibit 3: One year forward P-E ratio across select developing and developed countries
(x)
25.0
20.0
15.0
10.0
5.0
-
Source: IMF, Angel Research
Market Outlook
January 31, 2018
Exhibit 4: Relative performance of indices across globe
Returns (%)
Country
Name of index
Closing price
1M
3M
1YR
Brazil
Bovespa
84,482
11.6
12.0
30.9
Russia
Micex
2,280
8.7
11.4
2.1
India
Nifty
11,050
5.5
6.6
28.4
China
Shanghai Composite
3,488
4.9
2.2
10.6
South Africa
Top 40
52,700
1.2
0.6
14.2
Mexico
Mexbol
50,383
3.1
3.1
7.0
Indonesia
LQ45
1,103
1.9
11.7
24.7
Malaysia
KLCI
1,869
5.0
7.0
12.2
Thailand
SET 50
1,186
4.3
9.2
21.9
USA
Dow Jones
26,077
5.3
11.4
31.3
UK
FTSE
7,588
(0.5)
1.1
6.8
Japan
Nikkei
23,292
1.5
6.8
24.0
Germany
DAX
13,198
1.7
0.5
14.4
France
CAC
5,474
2.5
(0.4)
13.4
Source: Bloomberg, Angel Research p68in4
Market Outlook
January 31, 2018
Research Team Tel: 022 - 39357800
DISCLAIMER
Angel Broking Private Limited (hereinafter referred to as “Angel”) is a registered Member of National Stock Exchange of India
Limited,Bombay Stock Exchange Limited and Metropolitan Stock Exchange Limited. It is also registered as a Depository Participant with
CDSL and Portfolio Manager with SEBI. It also has registration with AMFI as a Mutual Fund Distributor. Angel Broking Private Limited is a
registered entity with SEBI for Research Analyst in terms of SEBI (Research Analyst) Regulations, 2014 vide registration number
INH000000164. Angel or its associates has not been debarred/ suspended by SEBI or any other regulatory authority for accessing
/dealing in securities Market. Angel or its associates/analyst has not received any compensation / managed or
co-managed public offering of securities of the company covered by Analyst during the past twelve months.
This document is solely for the personal information of the recipient, and must not be singularly used as the basis of any investment
decision. Nothing in this document should be construed as investment or financial advice. Each recipient of this document should make
such investigations as they deem necessary to arrive at an independent evaluation of an investment in the securities of the companies
referred to in this document (including the merits and risks involved), and should consult their own advisors to determine the merits and
risks of such an investment.
Reports based on technical and derivative analysis center on studying charts of a stock's price movement, outstanding positions and
trading volume, as opposed to focusing on a company's fundamentals and, as such, may not match with a report on a company's
fundamentals. Investors are advised to refer the Fundamental and Technical Research Reports available on our website to evaluate the
contrary view, if any.
The information in this document has been printed on the basis of publicly available information, internal data and other reliable
sources believed to be true, but we do not represent that it is accurate or complete and it should not be relied on as such, as this
document is for general guidance only. Angel Broking Pvt. Limited or any of its affiliates/ group companies shall not be in any way
responsible for any loss or damage that may arise to any person from any inadvertent error in the information contained in this report.
Angel Broking Pvt. Limited has not independently verified all the information contained within this document. Accordingly, we cannot
testify, nor make any representation or warranty, express or implied, to the accuracy, contents or data contained within this document.
While Angel Broking Pvt. Limited endeavors to update on a reasonable basis the information discussed in this material, there may be
regulatory, compliance, or other reasons that prevent us from doing so.
This document is being supplied to you solely for your information, and its contents, information or data may not be reproduced,
redistributed or passed on, directly or indirectly.
Neither Angel Broking Pvt. Limited, nor its directors, employees or affiliates shall be liable for any loss or damage that may arise from
or in connection with the use of this information.